Introduction
Sometimes ago (well quite some times now), Microsoft has released various sample SharePoint site templates also known as the “Fantastic 40”. We thought it would be interesting to start from one of those templates in order to provide a complete reporting solution that will demonstrate how “Enesys RS Data Extension” can really give another dimension to business data stored in SharePoint sites.
We decided to go on with the “Sales Lead Pipeline” application template considering that this template may be well suited for companies who don’t necessary need a full fledge CRM application.
Sales Lead Pipeline Application Template
The Sales Lead Pipeline application template provides various lists and custom features for managing a simple sales pipeline:
- Leads – a custom list for collecting business leads. A lead can then be converted into an opportunity and an account with just once click.
- Opportunities – a list for managing opportunities. It contains information copied from leads once it has been converted plus columns for managing stage, probability, close date,…
- Accounts – a list for managing qualified accounts resulting from converting a lead into an opportunity.
- Contacts – classic SharePoint contact list
- Dashboard – a very simple dashboard that will display unassigned leads as well as opportunities grouped by stage, size, …
Reporting solution
As flexible as this application template can be, it falls short of giving the necessary key figures needed by a sales manager to monitor performance and sales forecast.
That’s were “Microsoft Reporting Services” super charged with “Enesys RS Data Extension” comes into play. By building sophisticated reports at a fraction of the cost that it would take to develop a custom solution, you can provide key figures, data analysis, sophisticated dashboards that will transform this template into a full featured Sales Pipeline application.
Even better, we have already built all the reports for you. The reports are packaged in a Business Intelligence Development Studio 2008 solution. With some minor modifications to address your own SharePoint site, you will be able to run and deploy those reports for your own use.
Requirements
Enesys RS Data Extension 3.2 and more.
Business Intelligence Development Studio 2008.
Optionally SSRS Report Server 2008 if you would like to deploy the reports (reports can be executed within BIDS without deploying them on a report server).
Sales Lead Pipeline Reports
In this section we will give an overview of the reports available in the reporting solution.
Leads
Leads Analysis provides a dashboard view of leads that have not yet been converted into opportunities.

New Leads provides detailed information on leads which have not yet been converted to opportunities.

Parameters:
- Detail Level – Rating or All leads
Opportunities
Opportunities Analysis provides a dashboard view of Won or Lost Opportunities for a specific month. It also provides a comparison with previous years.

Parameters:
- Year
- Month
- Stage – Won or Lost
Notes :
- This report use several datasets.
- The “Year” parameter will only display valid years by retrieving distinct years within the opportunities list.
Open Opportunities provides detailed information on Owner’s open opportunities between two dates.

Parameters:
- Start Date
- End Date
- Detail Level – Level of detail to display: Owner, Month or Opportunity
Notes:
- Use of a hidden parameter to specify the minimum probability that an opportunity must meet for being taken into account in the report.
- You can choose the display detail level by specifying “Detail Level” parameter (Opportunity, Month, …). Depending on the detail level selected, the format of the report will be changed.
Won and Lost Opportunities displays details about Won and Lost opportunities for the specified date interval.

Parameters:
- Start Date
- End Date
- Stage – Won or Lost
- Detail Level – Level of detail to display: Owner, Month or Opportunity
Current Month Forecast report will display (in a given month) closed revenue + forecasted revenue based on expected revenue opportunity weighted by probability.

Parameters:
- Date – any date in the desired month
- Detail level – Owner or Opportunities
Future Forecast report will display forecasted revenue starting from a specific date, by Year, Quarter, Month and owner.

Parameters:
- Start Date
- Detail level – Year, Quarter, Month or Owner
Owners
Owner Analysis provides a dashboard view of Owner’s accomplishments for a given month. It also provides a comparison with former years.

Parameters:
- Owner
- Stage – Won or Lost
- Year
- Month
Revenue Performance provides a detailed view of revenues in the specified date range, by Year, Quarter, Month and owner.

Parameters:
- Start Date
- End Date
- Detail Level – Year, Quarter, Month or Owner
Installing and configuring
Sales Lead Pipeline Application template
If you haven’t already done so, you will need to install the “Sales Lead Pipeline” Application template and create some site from this template. The Sales Lead Pipeline application template can be downloaded individually on Microsoft web’s site at the following address (be aware that you will also need to download Application Template Core Solution – a link is available on the following page):
Downloading the reporting solution
The Sales Lead Pipeline Reporting Solution is available for downloading on our web site’s Downloads page.
Once you have downloaded the zip file, extract it in the desired folder.
Be aware that the reports have been developed using Business Intelligence Development Studio 2008. They are therefore not compatible with both BIDS 2005/SSRS 2005. We took the decision to build on top of SSRS 2008 because charts are looking far better in this version.
Configuring the Reporting Solution
Because we are using a data source level variable (a new feature introduced in Enesys RS Data Extension version 3.2) , you will only need to change the data source connection string so that it points to your SharePoint server and SharePoint site.
Double click on SharePointServer.rds shared data source in the solution explorer.
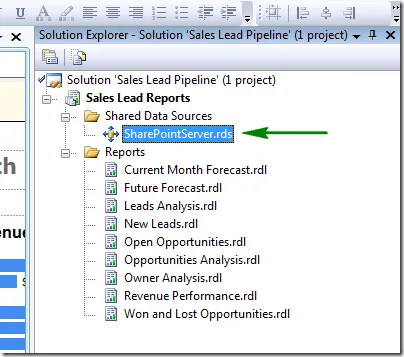
Change the connection string “server” and “$site_url!” properties. The “server” property should be assigned the URL of your SharePoint site; $site_url! should be assigned the relative site URL of your sales lead pipeline site.

Click OK to make the change. That’s all you need to do to start running the reports from BIDS. Of course you will need to enter some data (leads, opportunities, …).
Conclusion
Hopefully, this complete reporting solution will let you appreciate how “Enesys RS Data Extension” can leverage your business data managed in SharePoint sites. Combined with Reporting Services SharePoint Integration mode, it makes it possible to provide a completely integrated solution by making reports available directly within your site as shown in the following screen shot:

Obviously, the Sales Lead Pipeline application template has much room for improvement. There is some chance that you will customize the various lists in order to make it a more workable real world solution. We didn’t work on the basis of any customization to make our reporting solution work right out of the box, however the reports can be customized at will in order to accommodate any possible additions to the site.
We have found the following article that provides some ideas on how the template could be extended. You would also wants to add come columns for dealing with Margin, Owner’s accuracy, etc…
We hope you will enjoy the solution.
- Applies toEnesys RS Data Extension 3
- Last Updated2009-10-28T00:00:00.000Z
- CategoriesSamples