Quick start
This chapter shows how to quickly create a report using data from a SharePoint list. If you have already built reports with Business Intelligence Development Studio, you may want to skip this section.
Creating a new report project
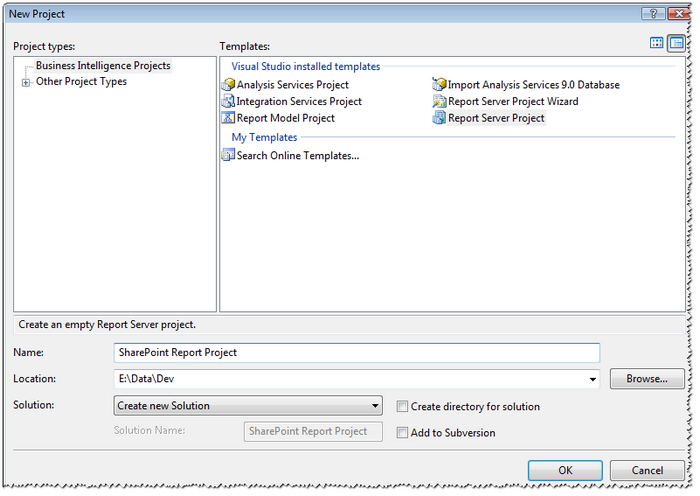
Section titled “Creating a new report project”Open Business Intelligence Development Studio or Visual Studio 2005 (2008) and create a new Report Server Project.
Adding a new report
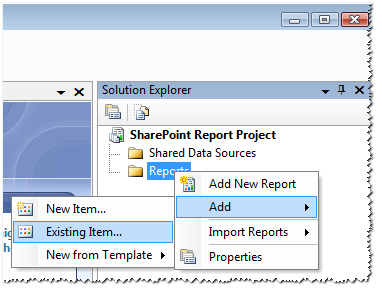
Section titled “Adding a new report”Right-click on Reports in the solution explorer and add a new item:
Select “Report” in the templates list and click on the Add button:
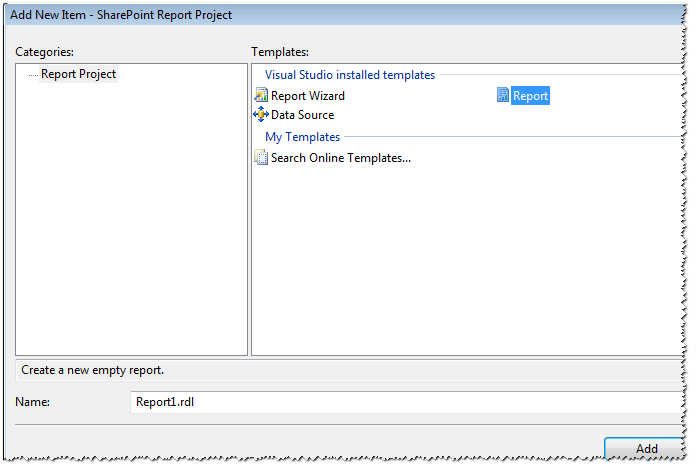
A new empty report named Report1.rdl will be created.
Creating a dataset
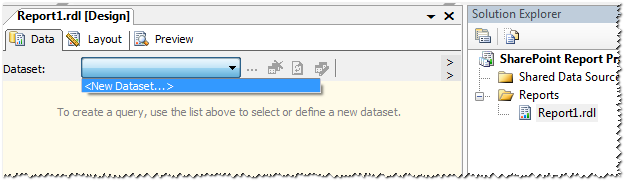
Section titled “Creating a dataset”Develop the Dataset scroll-down list and select New Dataset .
As no shared data source is initially defined, you will be proposed to create a new data source. See the “ ” chapter just below.
Then, click OK to create the dataset. Now you must create the query that will make it possible to retrieve data from SharePoint lists.
Creating a data source
Section titled “Creating a data source”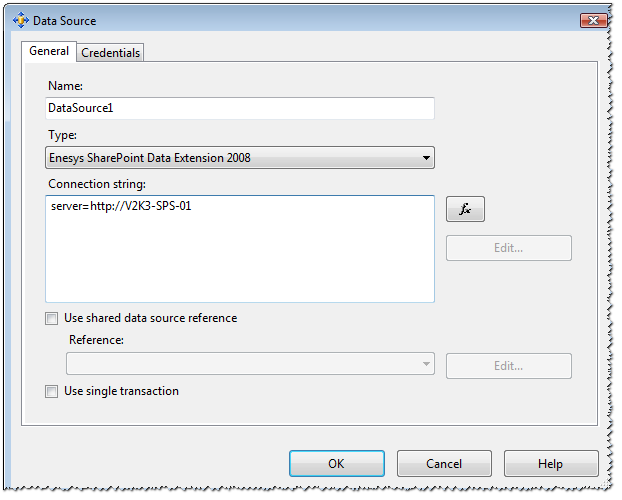
Enter the following information:
| Field | Description |
| Name | Name that you would like to give to your data source; for example, the name of the SharePoint server from which you will retrieve data. |
| Type | Select ” Enesys SharePoint Data Extension 2008 ” from the dropdown list. |
| Connection string | Specify your SharePoint server by using the following syntax: server=http://spsdemo or data source=http://spsdemo |
Select the Credentials tab and use the desired authentication method. Windows Authentication should be fine for the purpose of testing a simple report provided that you have the necessary rights to read SharePoint lists.
For more information about the connection string and its options, please
see the “ ESQ_Connection_String ” chapter.
Designing the query
Section titled “Designing the query”Enesys RS Data Extension provides a Visual Query Builder that allows you to build queries without the need to know the details of the query language.
Adding a new list statement
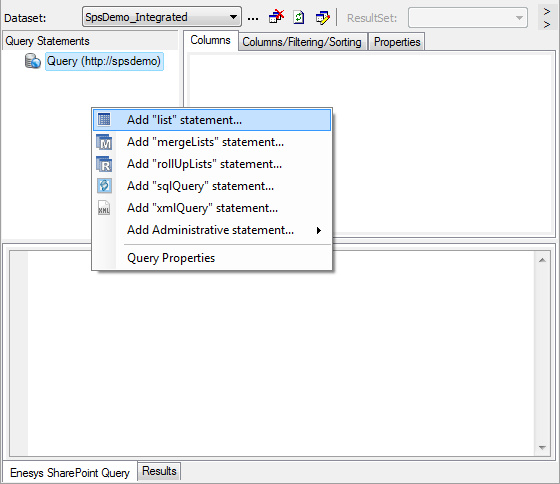
Section titled “Adding a new list statement”A root node is automatically available in the “Query Statements” panel with the properties entered in the Data Source:
- Right click on the “Query Statements” panel.
- Click on “Add list statement…” to add a new list statement.
- Enter the relative site URL and click on “Check available lists” to get all the lists in this site.
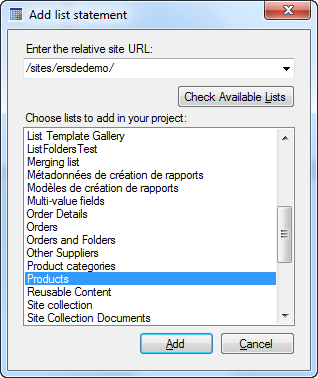
- Choose the desired lists and click on the “Add” button.
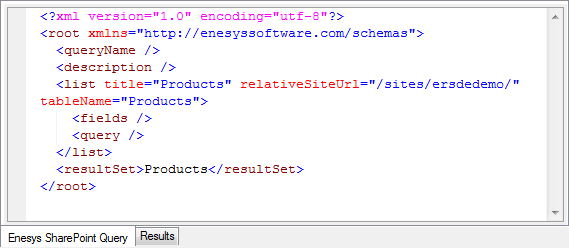
You can see the automatically generated query inside the “Enesys SharePoint Query” panel.
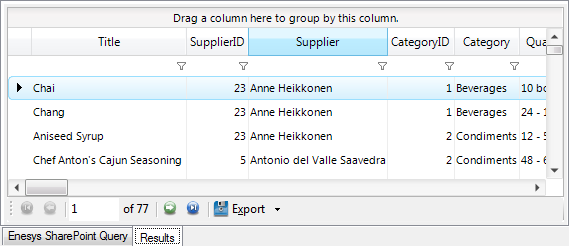
Running the query
Section titled “Running the query”In order to test your query, click on the execute button (
 ).
).
You should get all the items from your SharePoint list in the “Results” panel, as shown in the following screenshot:
Information
You can also write the query directly using the XML Editor. Click on the switch button to choose your editor:
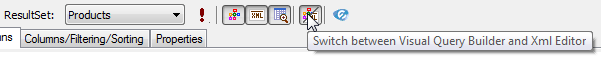
Please note that some features (such as listID or customFields ) are not currently supported by the Visual Query Builder. In such cases, you will be forced to use the Xml Editor.
Layout
Section titled “Layout”Once the query was created, the next step is to design a layout for your report.
Note that if you have just created the dataset, you may have to click
the “refresh
fields” button to display the list
of fields that can be used in the report’s layout.
button to display the list
of fields that can be used in the report’s layout.
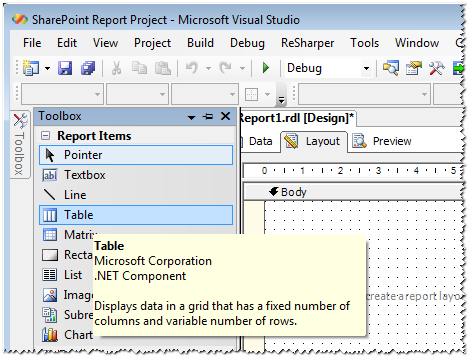
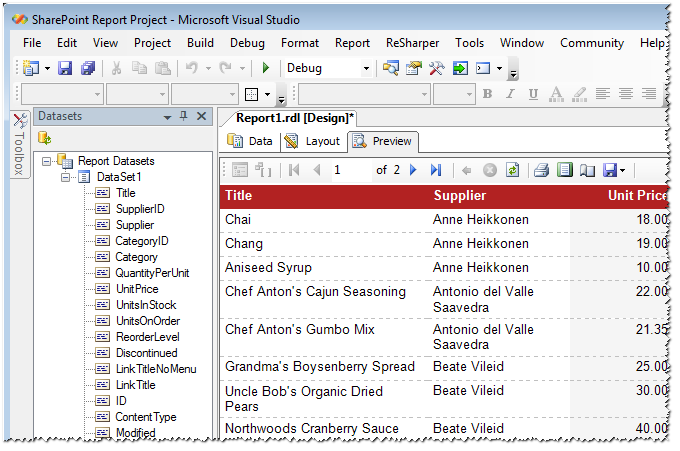
Select the Layout view.
Drag the Table component from the toolbox available at the left side of the report designer
Drag the desired column from the SharePoint list into the table you have just added to the layout:
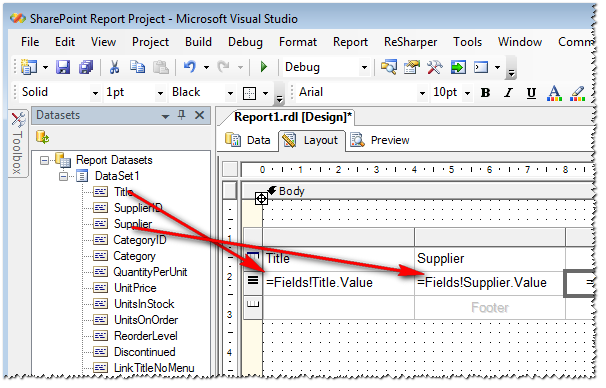
Change the style of the various cells to make the report more visually appealing and select Preview to see the result.
Conclusion
Section titled “Conclusion”For the most part, the information presented in this quick start guide is not specific to Enesys RS Data Extension . The approach is similar regardless of the type of data source being used.