Reporting on Survey lists
Introduction
Section titled “Introduction”The raw data returned from a SharePoint Survey List can’t be used as-is for building reports. This is due to the fact that each answer is represented by a single column in a survey list. This makes it impossible to use for most reporting scenarios.
To overcome this limitation, the survey statement applies a transformation to the initial survey list data in order to provide you with data that can be used for building reports.
The schema returned by the survey statement is static and does not depend on how many questions you may have in your Survey. The following table describes the schema returned by the survey statement:
| Field | Description |
|---|---|
| QuestionID | An auto-increment ID, each question having a different ID. |
| FieldType | The type of the SharePoint field (Text, Number, Choice, GridChoice…). |
| FieldName | The display name of the field (the question title). |
| GridStartNum | Only used with GridChoices. Represents the first available number. |
| GridEndNum | Only used with GridChoices. Represents the last available number. |
| GridTxtRng1 | Only used with GridChoices. Contains the text representing the first number. |
| GridTxtRng2 | Only used with GridChoices. Contains the text representing the middle number. |
| GridTxtRng3 | Only used with GridChoices. Contains the text representing the last number. |
| GridNATxt | Only used with GridChoices. Contains the text used for the “N/A” option. It may be null if the “N/A” option is not available for this GridChoice. |
| SubQuestionTitle | Only used with GridChoices. Contains the name of the GridChoice option. |
| Choice | Contains the possible values of this question. |
| AnswerID | Contains the ID of the user answer. |
| Value | Contains the user answer to this particular question. |
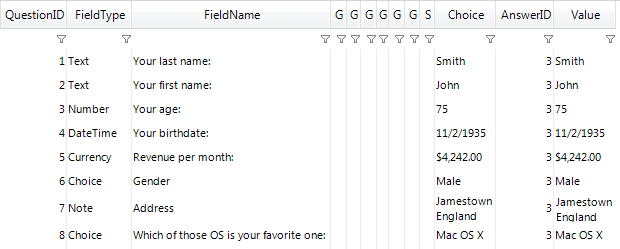
For example, if your Survey is composed of 10 questions, you will have about 10 lines returned for each user answer (the number varies depending on the question types and the options you have selected – see later in the documentation).
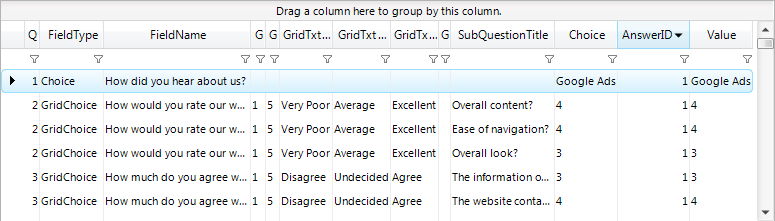
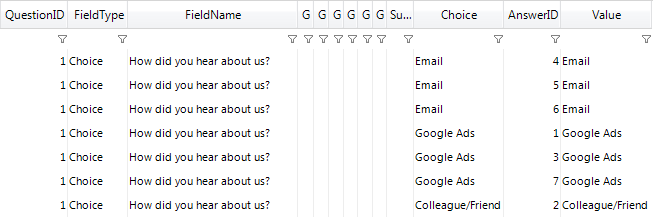
Here is a sample data for 3 questions and a single user answer:
-
The user answered “Google Ads” to the “How did you hear about us?” question
-
For the question “How would you rate our website” with a scale from 1 to 5, the user gave a note of 4 to “Overall content”, a note of 4 to “Ease of navigation” and a note of 3 to “Overall look”.
-
For the question “How much do you agree with each of the
following statements about the website” with a scale from 1 to 5, the user gave a note of 3 to “The information on the website is clearly written and easy to understand”, and a note of 4 to “The website contains no grammar or spelling errors”
Adding a Survey statement
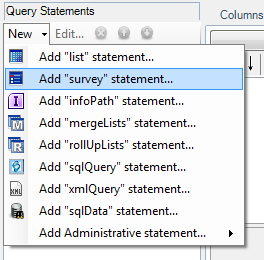
Section titled “Adding a Survey statement”- Add a new Survey statement to your query
- Enter the relative site URL or select an existing data source variable that points to the Survey list and click on the “Get Lists” button. Only lists of type “Survey” are displayed.
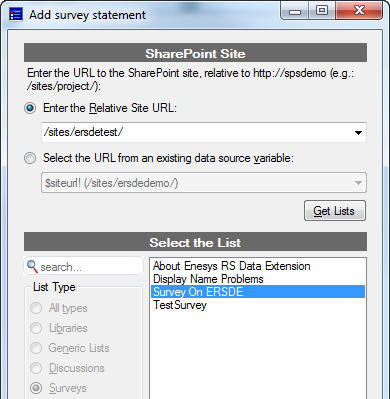
- Select the Survey list(s) you want to query and click on Add.
Selecting the fields
Section titled “Selecting the fields”It’s not possible to select any field with the survey statement. It will always return all the columns available in the static schema described previously.
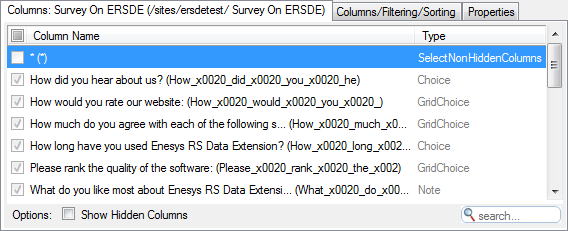
Please keep in mind that the columns that are displayed in the query designer Columns panel represent the schema of the initial SharePoint survey list and not the schema that is returned after transformation by the survey statement:
Filtering data
Section titled “Filtering data”Because the survey statement returns a schema that is completely different than the initial SharePoint survey list schema, filtering data can be confusing.
Basically, you have two possible approaches for filtering the Survey data:
- Filtering at the list level. In that case, conditions will rely on the initial survey list schema. In that schema, each question is represented by a column.
- Filtering on the transformed data by using an additional SqlQuery statement and apply a SQL Select operation.
Filtering before transformation
Section titled “Filtering before transformation”Similarly to the list statement, you can filter at the statement/list level.
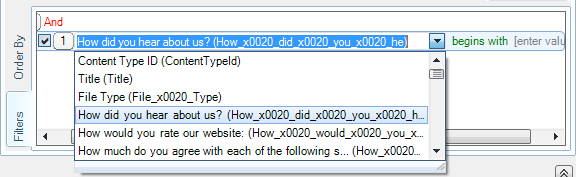
When filtering at the statement/list level, Enesys RS Data Extension will transform your conditions into CAML query so that the filtering take place at the SharePoint level. Therefore, your condition will rely on the initial SharePoint survey list schema which is completely different than the resulting schema returned by the survey statement.
Though, this can be confusing, just keep in mind that there are certainly very few scenarios that would make it necessary to filter at this level.
Here are some filtering examples:
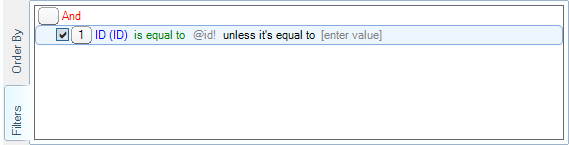
- Retrieving a specific user answer identified by its ID:
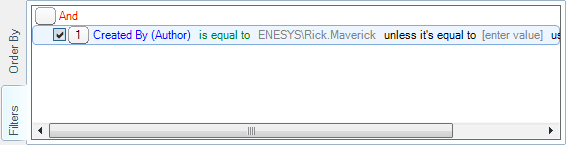
- Retrieving all the answers of a specific user:
You can find more information inside the “ ” chapter of the list statement, page .
Filtering on the transformed data
Section titled “Filtering on the transformed data”This is certainly the most natural approach for filtering your survey data. It is obviously much more natural to filter data based on the schema returned (that is the data you are manipulating in the end) rather than doing the necessary “mental shift” between the initial and target schema.
For filtering using this approach, you will add a sqlQuery statement that will let you apply a SQL SELECT operation to your survey data.
For example, if you don’t want to include the answers to a particular question, you can add a sqlQuery statement with the following query:
SELECT *FROM [MySurveyList]WHERE [FieldName] != 'How did you hear about us?'Survey Properties
Section titled “Survey Properties”Most of the survey properties work exactly the same way as for the list statement. You may refer to the associated documentation for list statements.
However, two new properties are specific to the survey statement: includeAllOptions and expandMultiValues :
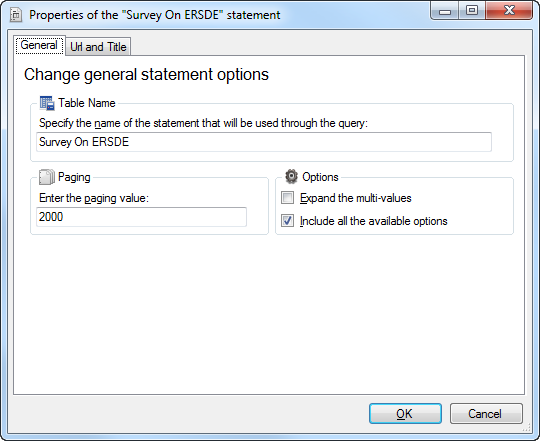
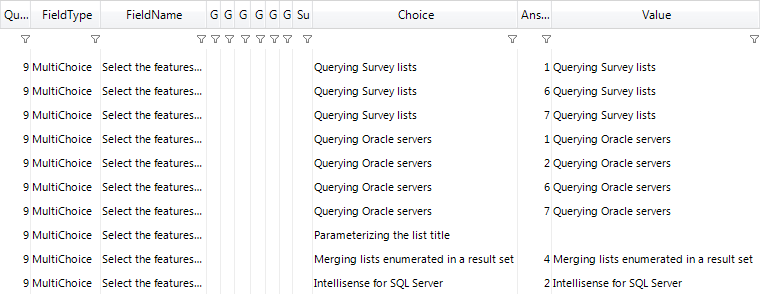
Removing the options that are not selected
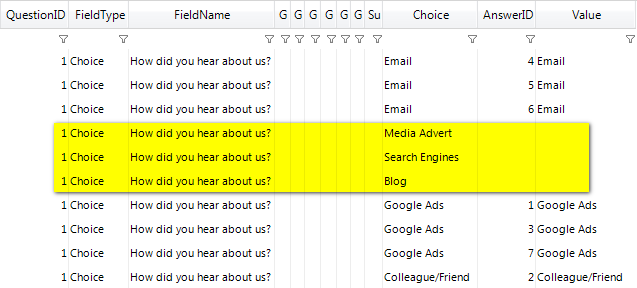
Section titled “Removing the options that are not selected”The includeAllOptions allows you to indicate whether you want to include the options for which no user selected this option. For example, the users may not have selected all the options of your “Choice” question.
If includeAllOptions is true (default behavior), even the choices that are not selected are retrieved. On the contrary, if includeAllOptions is false , the choices that were not selected are not retrieved.
Please note that all the possible values for the “GridChoice” (Rating scale) columns are always returned, even if the includeAllOptions option is false .
This option may be particularly useful to set to false for two scenarios:
- You are retrieving the data of a particular item:
Generally, you don’t care about the choices that the user didn’t select: you only want the choice the user selected.
- With includeAllOptions = true , you have several items for each questions of type Choice, MultiChoice or Boolean:
- With includeAllOptions = false , you have only a single item for each question, so your report will be easier to build.
- You are retrieving all the data and you don’t want to display the choices that are not selected:
- With includeAllOptions = true , all the choices are retrieved.
- With includeAllOptions = false , only the selected choices are retrieved.
Expanding the multi-values
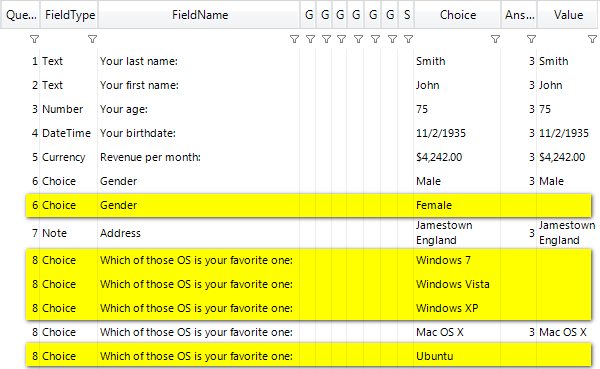
Section titled “Expanding the multi-values”By default, the multi-values answers are not expanded, and each selected value is separated with a semicolon and a space (“; ”), to match the default behavior of SharePoint. (You can change this separator by editing the multiValuesSeparator value)
For example, if the expandMultiValues option is false (default behavior):
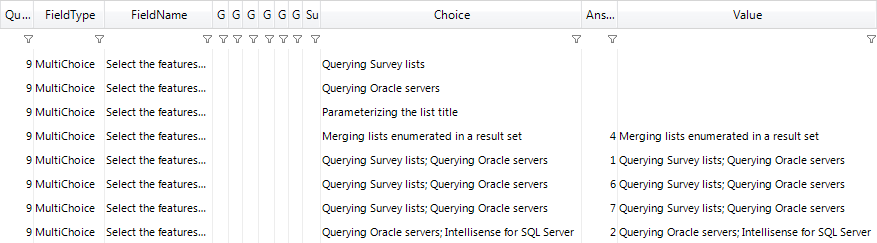
And if the expandMultiValues option is true :